Performance Testing for Enterprise Applications: A Step-by-Step Guide
When you’re building or maintaining enterprise software, it’s easy to focus on features, stability, performance, or visual appeal. But the truth is, you need all of it to work well together.
While feature and UI polish often take center stage, performance silently shapes user experience, business outcomes, and operational stability. No matter how beautifully designed or functionally rich your application is, if it slows down or crashes under load, your users and your revenue will walk away.
Even the best-designed systems can stumble without rigorous performance testing. In fact, poor enterprise application performance directly impacts business operations, leading to lost revenue, customer churn, and even reputational harm.
What is performance testing in enterprise applications?
It's the process that focuses on evaluating how well enterprise software performs under different load conditions for system stability, responsiveness, and resource efficiency. Unlike functional testing, performance testing discloses the resource efficiency and system reliability, responsiveness, especially when faced with real-world user traffic.
What tools are used for enterprise performance testing?
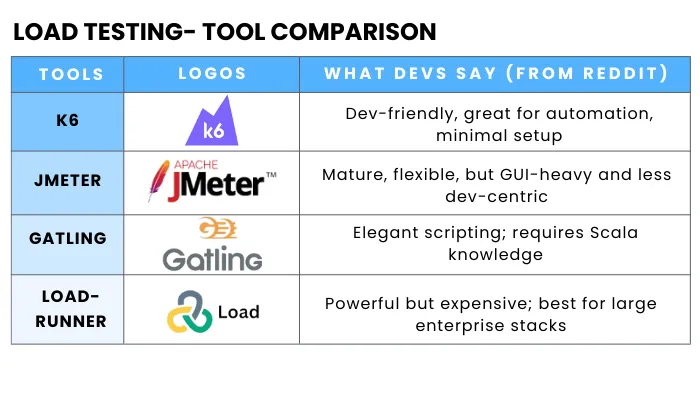
Common tools include JMeter, k6, Gatling, LoadRunner, and BlazeMeter, depending on your infrastructure and automation needs.
The scope of performance testing encompasses:
- Distributed Architecture Focus: Modern enterprises often rely on intricate architectures involving microservices, cloud-native deployments, hybrid infrastructures, and even legacy systems. Performance testing must account for the unique challenges these distributed environments present.
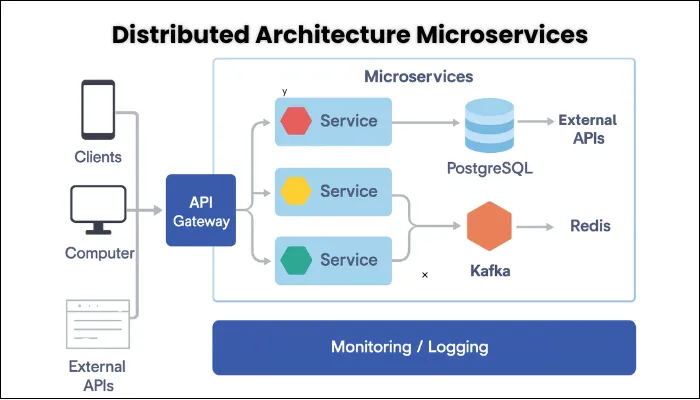
- Data Volume: Enterprise applications handle thousands, sometimes millions, of concurrent users and process vast datasets. Performance tests accurately simulate these extreme conditions, ensuring stability with numerous concurrent users.
Why is Performance Testing Important?
Performance testing is a critical aspect that directly influences the success and effectiveness of your enterprise application. And the following reasons are compelling enough to back up this claim:
- Business Continuity: Performance issues can lead to outages and slowdowns, halting the overall outcome and growth. Proactive testing avoids such scenarios, leading to significant improvements.
- User Satisfaction and Retention: Fast and responsive applications directly lead to happier users, higher engagement, and reduced churn for customer-facing systems.
- Reputation: Every poorly performing app will have a negative reputation that can severely tarnish the brand’s reputation and public perception. With the right performance testing, you can prevent that from happening to your app.
- Capacity Planning: Performance tests provide data-driven insights, enabling organizations to scale infrastructure efficiently, avoiding both expensive over-provisioning and detrimental
What Performance Testing Challenges do Enterprises Face?
Undeniably, performance testing provides several benefits, but still, many organizations fail to leverage it to its maximum potential. And that is because of the formidable set of challenges associated with this testing.
- Complexity of Distributed Architectures: Modern enterprise applications are often a mixture of interconnected microservices, APIs, cloud services, and on-premise components. With several components functioning together, simulating realistic traffic across these systems and accurately pinpointing the cause of issues becomes intuitively complex.
- Environmental Parity: Testing on a production-like environment, including hardware, software versions, network configurations, and data, is crucial to avoid ‘it worked in testing, but failed when live’ scenarios. Nevertheless, creating a similar environment might bring significant costs and technical challenges. Achieving sufficient parity is pivotal for reliable results.
- Integration with Third-Party Systems: To extend functionalities and offer better features, several apps depend heavily on external APIs, payment gateways, CRMs, or even legacy systems. As these are external systems, you have limited control over their environments, making testing troublesome.
However, before moving further, readers are expected to have a foundational understanding of:- Basic software testing concepts and methodologies.
- The Software Development Life Cycle (SDLC) and development models.
- Familiarity with common operating systems and networking fundamentals.
How to Perform Performance Testing on Enterprise Applications?
The entire process has been segregated into several steps to enhance its understandability. The goal is to provide you with a practical, end-to-end framework that you can apply to ensure your systems meet performance expectations under real-world conditions.
Step 1: Setting the Bar
Performance testing in enterprise applications is more than pressing run on a tool or ticking a checklist. It’s about deeply understanding the business lifelines your applications support and preparing a test environment that reflects how the system runs. Getting this foundation right sets you up for meaningful tests, valuable insights, and confident decision-making.
- Business Goals and SLAs: Rather than moving directly to scripts or load generation, step back and ask yourself, what happens if this system slows down or fails? In most cases, enterprise apps manage mission-critical processes.
By any chance, if any single one of such features breaks or lags, the business faces serious consequences such as lost revenue, damaged partnerships, and regulatory penalties.
The first step you need to take is to speak directly with business owners, product managers, operations leaders, and stakeholders to identify the critical workflows.
Find out what success looks like to them. Sometimes, they or you may have a vague goal in mind, such as making the system work faster. However, you have to aim for clear, measurable targets, such as ‘invoice generation, which must be completed within 20 seconds for 99.9% requests during peak load.’
All such targets are known as Service Level Agreements (SLAs), and they are your north star for test design, execution, and evaluation. - Creating Test Environment: One of the faster ways to perform performance testing is in an artificial environment. But, only if you want misleading results. Enterprise apps run in complicated environments.
Without replicating the environment, your tests risk missing critical bottlenecks or false positives, leading to a common phenomenon of ‘everything looks fine in tests, but real users still suffer.’
With that in mind, your goal is to create a test environment to closely match the production setup, including hardware specs, network configurations, software versions, and key dependencies.
If exact parity isn’t possible, the best course is to be transparent about the differences and understand how they might influence your results. - Prioritize Critical User Journeys: Enterprise applications support countless user interactions and automated processes, but not all are equally important to test. Production logs, monitoring tools, and business input data can be used to pinpoint which workflows drive the bulk of system load, revenue, or business risk.
For example, login processes, order approvals, financial settlements, or key integration points often deserve your focus because if they slow or break, whole teams or partners grind to a halt. Concentrate your scripting and load modeling here. - Choose Tools that Scale with Your Complexity: When selecting tools for performance testing, think beyond features and consider how well they integrate into your existing ecosystem. The tools should be compatible with your CI/CD pipeline, monitoring and observability, and your reporting workflows. A good fit supports automation, detailed analysis, and collaboration across teams.
Choose tools that integrate with your CI/CD pipeline and monitoring ecosystem. Categories include:- Load & Stress Testing Tools
- Open Source: JMeter, k6, Gatling, Locust, Vegeta
- Commercial: LoadRunner, NeoLoad, BlazeMeter
- Application Performance Monitoring (APM)
- AppDynamics, Dynatrace, New Relic
- Metrics & Observability
- Grafana, Prometheus, ELK Stack (Elasticsearch/Logstash/Kibana)
- CI/CD Integration
- Compatible with Jenkins, GitLab CI, Azure DevOps, GitHub Actions
- Load & Stress Testing Tools
Tool Comparison Table:
Step 2: Designing Realistic Workloads and Test Scripts
After laying the groundwork of defining business goals, understanding environments, and prioritizing scenarios, it’s time to turn those insights into actionable test designs. In this step, you’ll convert the real-world usage into precise performance tests, which include simulating how users behave, how systems interact, and how transactions flow under load.
- Build a Realistic Workload Model: A workload model is your foundation for simulating user behavior and system demand during tests. It captures information about your users, including who they are, what actions they perform, when and how often, and how those influence your system load. To get it right, you need to focus on the following:
- Evaluate production data, including real logs, analytics, and application performance monitoring data, to understand user concurrency, transaction mixes, peak and off-peak patterns, and geographical distribution.
- As people naturally pause between actions, it's essential to include user thought times and pacing variations to simulate periods of activity and inactivity.
- Not all users behave the same. Some may perform quick lookups, others full transaction cycles, which is why you need to model different user profiles and devices.
- Plan for variability by considering sudden spikes, long-running batch jobs, and scheduled maintenance events.
- Design Reusable Performance Scripts : Consider scripts as the engines of your load tests, automating user actions and system interactions. However, scripting enterprise apps is more than recording clicks or API calls; they rely on session tokens, transaction IDs, encrypted fields, and multi-step workflows.
Your scripts need to handle these complexities gracefully. That means parameterizing data to avoid caching effects or bottlenecked scenarios, and capturing dynamic values so scripts can persist across different test runs.
Furthermore, enterprise scripts should include logic for response validation to confirm not only that the system is responding, but it's returning correct results even as conditions change under stress.
You need to structure scripts into reusable components representing standard functional blocks to simplify maintenance and support building complex test scenarios by composition. - Pick the Right Test Type: One test type cannot reveal the entire picture. Post establishing your baseline load tests to ensure the system meets expected performance goals, it’s crucial to run targeted stress tests that push the app well beyond the normal limits.
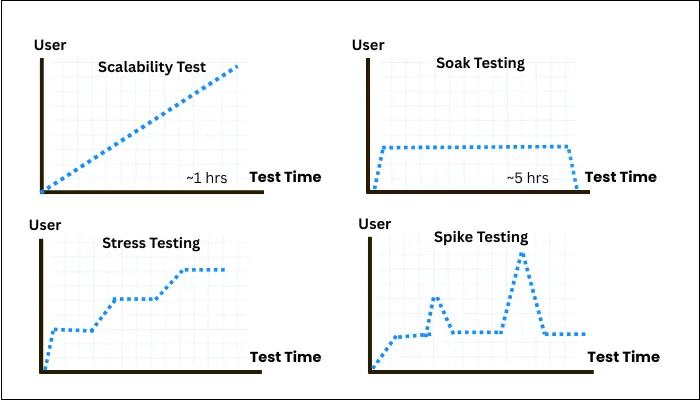
Beyond a baseline load test, consider:- Stress Testing: To prepare for unplanned surges or capacity planning, you need to push the system beyond expected limits to identify breaking points and failure modes. This prepares you for unplanned surges or capacity planning.
- Soak (Endurance) Testing: Run tests over extended periods (hours to days) to detect issues like memory leaks, resource exhaustion, or data corruption that only appear over time.
- Spike Testing: Simulate sudden bursts of traffic to check system elasticity and recovery speed, as it's crucial for unpredictable workloads.
- Scalability Testing: Incrementally increase system resources or load to verify linear or expected performance improvements, ensuring growth plans are valid.
Design your test scenarios to align with business priorities and production patterns, mixing and matching test types as needed. Remember, these tests complement each other and together provide a fuller performance picture.
- Design Considerations for Cloud-Native Apps: Testing in the Cloud? Don’t Skip This
- Simulate auto-scaling events during step ramp tests.
- Include cold start latency for containers or serverless.
- Monitor cost impact — some cloud platforms bill per request/load.
- Use tags or naming conventions to track test resources in billing.
Step 3: Test Execution and Monitoring
If the first two phases were about setting the stage, this phase is where enterprise performance testing proves its worth. Careful implementation and constant oversight distinguish professional-grade results from mere guesswork. Consider this not as a mechanical exercise, but as a high-stakes, orchestrated operation where discipline, foresight, and technology converge.
- Preparing the Test Environment: A credible test result depends entirely on the integrity of the environment you run it in. Data authenticity, configuration accuracy, and operational readiness matter here more than anywhere. Effective test cases are not created by random spin-up test systems.
They are the outcome of deliberate efforts to build environments that model business reality.
You need to populate your platforms with meaningful, synthetic data that mirrors production patterns, ensuring that edge cases and volume extremes are realistically represented.
In addition, execute configuration checks across servers, caches, services, and integrations, verifying that every element is at the correct version and state.
Apart from that, before unleashing heavy loads, run a quick smoke test. Now, many may consider it nitpicking. But in reality, it’s risk mitigation, revealing last-minute misconfigurations or connectivity issues that could poison your results.
To reduce manual slips and ensure consistency across test cycles, you can also automate environment setup and configuration validation. - Executing the Performance Tests: Execution is not just firing off a bulk load test. Here, infection points have to be discovered gradually and safely with clear lines of communication and fallback strategies in place to ensure recovery if anything goes south.
- Baseline Testing: Begin with a minimal load test to confirm system stability under normal operation. Using this baseline, you ensure that the environment and scripts run smoothly with limited stress. Consider it a performance health check and reference for future tests.
- Step Ramps: Once confidence is built, ramp up your load thoughtfully, ideally in 10% increments, allowing your observability stack and your team to spot inflection points and degradation before they escalate.
- Control and Coordination: Enterprise environments rarely run in isolation. Deployments, backups, and infrastructure patches may introduce noise or even danger. You have to proactively coordinate with operations and all relevant stakeholders, ensuring your tests don’t overlap with critical changes.
- Rollback Plan: Always design for failure by having a predefined rollback or mitigation plan. In the case of system overload, application crashes, or unplanned consequences, this plan ensures rapid restoration of service reliability.
- Real-Time Monitoring: Performance testing is useless without comprehensive, real-time observation. Monitoring happens on three critical layers: client-side, server-side, and application-specific internals:
- Client-Side Monitoring: This involves measuring the user’s lived experience through response times, error rates, and throughput using Dynatrace Real User Monitoring or New Relic Browser.
- Server-Side Infrastructure: Here, you need to keep a close eye on CPU load, memory usage, disk I/O, and network latency. Infrastructure monitoring tools such as Prometheus, Grafana, ELK Stack, and DataDog will help you collect and visualize system metrics in real time, allowing you to correlate resource utilization with load changes.
- Application-Specific Internals: To ensure that application-specific checks are performed, examine JVM garbage collection times, queue depths, threat pool size, and database connection pool saturation. Advanced Application Performance Monitoring tools, such as New Relic APM or AppDynamics, are your best bet to attain insight into app internals.
Read Also: Five Important performance testing types
Step 4. Reporting and Continuous Improvement
Performance testing is not just running tests and getting results, but more than crunching numbers. It’s about reshaping raw data into meaningful and strategic insights, where you take ownership of performance as an evolving discipline that leads towards the success of business enterprise software.
- Evaluating Test Results: Performance testing produces a vast amount of data, but the real value lies in your ability to cut through the noise and bring out what truly matters.
Now that you have the results, compare them against the predefined SLAs and KPIs that you established during the first step. By comparing those, you can identify system components that failed to meet expectations and quantify the severity of these deviations.
Common patterns such as rising latency correlating with CPU or memory bottlenecks, increased database query time, or batch job spikes impacting interactive workflows are signs that your app needs performance optimization.
In addition, you need to leverage cross-layer correlation where you match client-side UX degradation with back-end resource metrics and app-specific telemetry. Grafana, AppDynamics, or New Relic are the top tools that can help you spot trends and anomalies. - Performance Metrics to Track in Enterprise Application: These are the key metrics every performance testing team should track during enterprise application testing. Each metric offers insight into how the system behaves under load, where weaknesses lie, and whether the application meets performance expectations.
Core Performance Metrics
Metric Why It Matters Average Response Time General speed of your app under normal conditions. 95th / 99th Percentile Latency Highlights worst-case user experience the "slowest of the slow." Peak Response Time Captures system reaction during traffic spikes. Throughput (TPS/RPS) Number of transactions or requests per second — shows system capacity. Error Rate Identifies stability issues: timeouts, 500s, broken flows, etc. Concurrent Users Helps assess how the system handles load from real user traffic patterns. Infrastructure & System-Level Metrics
Metric Why It Matters CPU Utilization High values show system stress; consistent 90%+ = bottlenecks. Memory Usage & Leaks High or growing usage indicates inefficiencies or memory leaks. Disk I/O Important for database-heavy applications; affects read/write speed. Network Latency Measures request-response time across internal and external calls. GC Time (Java/.NET) Long or frequent garbage collection slows app performance. Thread Pool Utilization Shows if thread resources are being exhausted under load. Application-Specific Metrics
Metric Why It Matters Database Query Latency Slow queries can throttle app speed especially under concurrent access. Connection Pool Saturation Running out of DB or API connections causes queuing and request failures. Cache Hit Ratio Low cache hits = more backend load = slower performance. Queue Lengths & Lag In event-driven systems (Kafka, RabbitMQ), this shows processing delays. API Latency by Endpoint Helps find slow services or APIs under specific test scenarios. Transaction Success Rate Tracks business-critical flows (e.g., logins, payments, checkouts). Business and User Experience Metrics
Metric Why It Matters Time to First Byte (TTFB Key for perceived speed, slow TTFB can feel like app isn’t responding. First Contentful Paint (FCP Measures what users see first, a core frontend UX metric. Bounce Rate During Load racks if users abandon your app when performance drops. Revenue per Second (under load) % of requests that meet agreed performance targets — critical for reporting. SLA Compliance Rate % of requests that meet agreed performance targets — critical for reporting. Cost per Test Run Important in cloud environments — high resource use = high cost. - Example performance testing metrics:
| Metric | Normal load | Peak load | Stress load |
|---|---|---|---|
| Avg. response time | 1.8 s | 4.3 s | 7.9 s |
| Error rate | 0.4 % | 4.5 % | 9.3 % |
| CPU utilisation | 65 % | 87 % | 96 % |
| DB query latency | 110 ms | 640 ms | 890 ms |
here is complete list for software testing metrics and KPIs
- Creating Performance Reports: The data you collect should be used to create performance testing reports. Your reports should speak to different audiences, from technical teams eager for granular details to executives requiring clear, business-oriented summaries. If you want a high-impact report, you should include the following elements:
- Executive Summary: Briefly explain the intent, issues, improvements, and results. The most effective summaries are concise and jargon-free.
- Objectives and Scope: Mention what was tested, why, under what assumptions, and the test types.
- Methodology: Describe workload design, environment setup, and test execution to establish credibility.
- Findings: Present key metrics with easy-to-interpret visuals such as graphs of response times, throughput, error rates, and resource utilization.
- Root Cause Analysis: Detail the performance bottlenecks identified, supported by evidence.
Recommendations: Prioritize actionable steps, including code optimizations, scaling strategies, and configuration tweaks.
Attribute Details Report Title Enterprise HRMS Portal Objective Evaluate the performance of HRMS under normal, peak, and stress loads. Key Results Average response time within SLA under normal load; errors exceed threshold at peak. Main Bottleneck Database latency during payroll processing. Action Items Optimize SQL queries, increase the database pool size, and tune the JVM. Goals Ensure SLA compliance, identify bottlenecks, and support production readiness. Modules Tested Employee Login, Leave Management, and Payroll Processing. Test Types Load Testing, Stress Testing, and Soak Testing. Assumptions Peak: 5,000 users, stable infrastructure, horizontally scalable app. Workload Design 70% login, 20% leave, and 10% payroll activity. Environment 4 App Servers (16 vCPU, 32 GB RAM), 2 DB Servers (8 vCPU, 64 GB RAM). Monitoring Tools New Relic, Grafana Load Generation Tool Apache JMeter 5.6 CI/CD Integration Jenkins Findings: Average Response Time 1.8 sec (Normal), 4.3 sec (Peak), 7.9 sec (Stress) Findings: Maximum Response Time 4.2 sec (Normal), 11.6 sec (Peak), 18.2 sec (Stress) Findings: Error Rate 0.4% (Normal), 4.5% (Peak), 9.3% (Stress) Findings: CPU Utilization 65% (Normal), 87% (Peak), 96% (Stress) Findings: Memory Utilization 58% (Normal), 81% (Peak), 93% (Stress) Findings: DB Query Latency 110 ms (Normal), 640 ms (Peak), 890 ms (Stress) Primary Bottleneck Complex unindexed SQL join in the payroll API. Evidence PostgreSQL slow logs; New Relic traces showing 60% response time in DB calls. Secondary Issues JVM GC inefficiency and thread pool exhaustion above 6,000 users. Recommendation 1 Optimize SQL (index employee_id, payout_id) – Dev Team – 2 days. Recommendation 2 Increase DB connection pool from 80 to 120 – DevOps Team – Immediate. Recommendation 3 Enable horizontal pod autoscaling – DevOps Team – 5 days. Recommendation 4 Tune JVM heap size and GC strategy – DevOps Team – 3 days. Recommendation 5 Implement caching for employee profile data – Dev Team – 7 days. Environment Details Ubuntu 22.04, Spring Boot 3.1, PostgreSQL 14 Test Data JMeter logs (CSV), APM traces (New Relic) Scenarios Tested Login → Dashboard → Logout; Login → Apply Leave → Logout; Login → Payroll → Download Payslip SLA Benchmarks Average Response Time: <2s (normal), <5s (peak); Error Rate: <1%; CPU Usage: <90%
- Embedding Performance into CI/CD and DevOps Pipelines: If performance testing remains a gated, occasional event, you're not preventing failure; you're postponing it. It's not a question of if the system will crash under pressure, but when.
By the time you find out, it’s already too late. You need to embed it into agile delivery cycles with automated pipelines that deliver fast and reliable feedback to developers and operations teams.
Start by integrating your preferred performance tools within CI/CD platforms such as Jenkins, Azure DevOps, or GitLab CI. Now automate runs of smoke or baseline performance tests triggered by code commits of builds, ensuring regressions are caught early.
Expand test scope gradually and scale for nightly or pre-release pipelines.
DevOps Alignment Tips:- Ensure staging mirrors production infra.
- Auto-publish test results to monitor dashboards.
- Automate rollback on test failure.
- Include performance checks in deployment approval workflows
- Fostering a Culture of Continuous Performance Improvement: Enterprise applications evolve, systems grow, business processes change, and new features are introduced to keep the app feature-packed and relevant over time.
As the app keeps evolving, your performance testing can’t remain static. It needs to be a living practice that adapts continuously.
Make sure to consider baselines from initial tests and track trends over time. This will help you understand what’s working and what’s not, allowing you to change as per the trend.
You can also review and recalibrate workload models regularly to reflect dynamic user behavior or business priorities.
Another way for enhanced continuous improvement is hosting periodic performance summits or reviews with cross-functional participation to discuss challenges and improvements.
Use lessons learned to refine testing strategies or re-architect bottlenecks before they impact customers.
Note: During a Black Friday sale, a client’s payment API collapsed under burst traffic. The root cause? A retry loop flooding the DB with the same failed transaction. Fixing it involved rate-limiting and caching inventory checks, reducing load by 35%.
For a broader view on aligning QA processes with enterprise goals, see our guide to implementing QA strategy for enterprise software
Performance Testing Maturity Model
Learn How Mature Is Your Performance Testing Practice
| Maturity Level | Characteristics |
| Level 1 | Manual scripts, limited test coverage, no SLA tracking |
| Level 2 | Automated tests in CI/CD, defined SLAs, some observability |
| Level 3 | Real-time observability, AI-driven insights, DevOps-integrated |
See how modern businesses are using AI for performance testing
Performance Testing Trends and Insights for 2025
The way we test performance is evolving fast. Enterprises looking to stay ahead are adopting practices that reflect the latest technologies, delivery models, and customer expectations. These trends are backed by real industry data:
| Trend | % Adoption | Characteristics |
|---|---|---|
| AI in Testing | 49% | Faster detection, smarter analysis |
| Shift-Left Testing | 65%+ | Shorter cycles, fewer late defects |
| Cloud-Native Load Testing | 82% | Matches real deployment behavior |
| Security-Performance Combo | 35% | Finds hidden edge-case risks |
| CI/CD Testing Integration | 68% | Safer, faster, automated releases |
Note/Tip: Adopting even one or two of these trends can help you detect performance issues earlier, reduce costs, and improve user experience—while staying ahead of your competition.
Conclusion
Performance testing isn’t just a checkbox-it’s a must. It helps you focus on what matters most to your app and your business. Done right, it drives better decisions and builds a culture of constant improvement.
The way we approach performance is changing fast. Enterprises that stay ahead are adopting new methods like:
- Chaos Engineering – Intentionally causing failures to uncover weak spots and build stronger systems.
- AI & ML – Moving beyond alerts to predict issues, auto-generate tests, and spot bottlenecks in real time.
- Observability Platforms – Combining logs, metrics, and user data for a clear, unified view of performance.
If unexpected slowdowns or outages are putting your business at risk, it’s time to act. ThinkSys can help you find hidden problems early, apply smarter testing techniques, and strengthen your systems for whatever comes next.
Frequently Asked Questions (FAQs)
Share This Article:


