SaaS Performance Testing: A Complete Guide for Multi-Tenant Scale
Performance issues hurt all software. But in SaaS, they hurt faster, more widely, and for longer. A traditional application might slow down for a few users on a local network. A SaaS product, on the other hand, slows down for everyone, across regions, often at the same time. There is no ‘install later’ option or a buffer to restart the system. If the app feels slow today, customers will notice it immediately, and many won’t wait for a fix.
That’s why performance testing in SaaS isn’t limited to technical stability, but it’s directly tied to revenue, retention, cost control, and brand trust. Why that difference matters in practice:
- Direct Revenue Impact: Large cloud vendors and conversion studies show tiny latency changes have measurable financial effects. These effects scale in SaaS because user interactions are frequent and often tied to conversion or retention events.
- Churn and Retention Risk: SaaS business models make retention paramount. Even small friction points that frustrate users can cause subscription cancellations or downgrades. Therefore, performance issues lead to long-term revenue leakage rather than on-time lost sales.
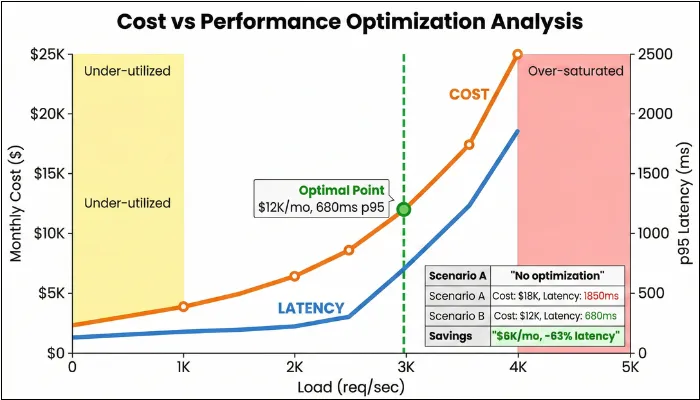
- Operational and Cost Exposure: Cloud elasticity can mask performance issues until a spike. With performance testing, you can find the sweet spot between cost and experience.
This article focuses on various aspects of performance testing for SaaS applications, giving you a detailed look at what you need to do to ensure your SaaS application remains stable and high-performing, even with large numbers of users.
What is Performance Testing in SaaS?
Performance testing in SaaS ensures that apps handle real-world demands, such as fluctuating user loads and multi-tenant interactions, without degrading tenant experience, violating SLOs, or driving cost spikes. It goes way beyond just checking how fast pages load, diving into resource efficiency, concurrent user handling, and long-term stability to keep services humming 24X7.
SaaS performance testing validates speed, stability, scalability, tenant fairness, and cost efficiency under production-like workloads. Unlike single-tenant apps, you must prove that one tenant’s spike won’t degrade another tenant’s experience.
One of the biggest misconceptions about application performance testing is that it’s all about response time. However, there is more to that. It involves simulating peak usage across global users to ensure the shared infrastructure doesn’t falter, which is critical, since downtime can cost your business up to $9000 per minute. Implementing this proactive approach helps you reduce outages by 60% through auto-scaling validation.
The article focuses on SaaS performance testing. Now you may think about how SaaS differs from traditional models. And your doubt will be cleared in the following section.
| Aspect | Traditional (On-Premise/Single-Tenant) | SaaS (Multi-Tenant/Cloud) |
| Infrastructure | Organizations rely on fixed physical hardware that requires manual intervention to upgrade or expand. | The environment utilizes software-defined, elastic resources that automatically scale based on demand. |
| Testing Focus | Engineering teams focus on isolated load patterns and minimizing latency within a local network. | Quality assurance prioritizes global concurrency, API rate limits, and ensuring strict data isolation between tenants. |
| Cost Model | This model requires high upfront capital expenditure for hardware and long-term maintenance costs. | Organizations move to an operational expense model based on monthly subscriptions or pay-per-use metrics. |
| Scalability | Scaling is strictly limited by the capacity of the physical servers and often requires significant lead time. | The system dynamically handles massive traffic spikes by distributing load across a shared pool of resources. |
| Downtime Risk | The environment is fully controlled, but localized hardware failures can lead to prolonged outages. | While providers offer high availability, shared resource failures can impact multiple customers simultaneously. |
| Maintenance | The customer is responsible for manually applying patches, security updates, and version upgrades. | The service provider manages all updates centrally, ensuring all users are always on the latest version. |
| Release Governance | Performance checks are periodic and manual. | Performance gates run in CI/CD with SLO-based pass/fail and evidence packs. |
2. Why SaaS Testing Matters?
In SaaS, performance is part of the product. Customers feel slowdowns immediately. Because many tenants share the same platform, one spike can impact many users. That’s why performance issues show up as churn, SLA risk, and engineering firefighting.
The Business Side of Things
Poor performance frustrates users, pushing them toward your competitors. And once they’re gone, winning them back costs significantly more than keeping them happy in the first place. With that in mind, these are some of the common ways in which poorly performing SaaS apps can hurt your business:
- Customer Churn: Monthly churn varies widely by segment, but performance regressions reliably increase cancellations, downgrades, and support tickets.
- SLA Violations: Most enterprise contracts include uptime guarantees. If your SaaS app breaches these triggers, you will receive service credits of 5-15% of your monthly fees. Your penalty clause might cap at one month’s subscription, but your customer’s actual losses don’t.
- Reputational Damage: Any negative news spreads like wildfire. A single viral post about your app crashing during peak hours can discourage potential customers and tarnish years of reputation-building. In fintech, especially, performance hiccups signal deeper reliability concerns that customers won’t tolerate.
Where Performance Issues Surface First in SaaS
- Where churn shows up first: onboarding flows, search and filtering, checkout/payment journeys, exports and reporting.
- Where SLAs hurt most: login, core transactional workflows, public APIs, and integration endpoints.
- Where cost surprises happen: database saturation, cache inefficiency, queue backlogs, and third-party API overuse.
- Where sales gets blocked: enterprise buyers demanding SLO definitions, performance evidence, and release governance proof.
Technical Debt You Can't See
The technical consequences are equally brutal, often lurking until the worst possible moment. In SaaS, that is labelled as “this tool slows me down at work,” which is basically the worst positioning you can earn.
- Hidden scalability bottlenecks only surface when real traffic hits. Your staging environment with 50 concurrent users tells you nothing about how the system behaves with 5,000.
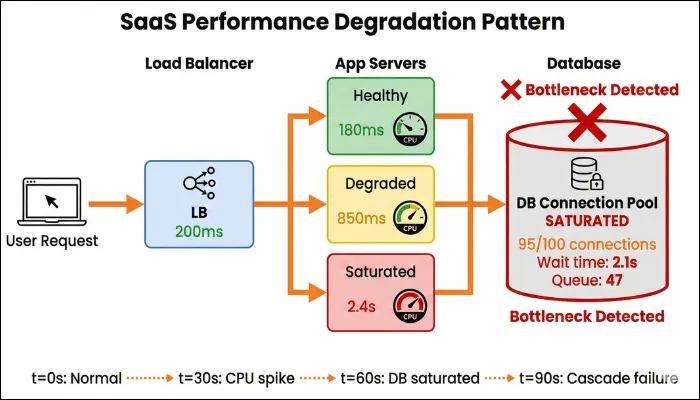
- Microservice cascading failures occur when a struggling service drags down everything it touches. If Service A relies on Service B, and B starts timing out, A backs up, which affects everything that depends on A, triggering a chain reaction that can take down your entire platform.
- Retry storms amplify problems rather than solve them. When services aggressively retry failed requests without proper backoff, 100 instances that retry 5 times each suddenly flood a failing service with 500 requests, making recovery impossible.
- Database saturation creeps up gradually. Slow queries, poor indexing, and unoptimized transactions accumulate until your database becomes the bottleneck, choking everything upstream.
How Performance Metrics Translate Into Business Risk
| Performance signal | What it usually means technically | What customers feel | Business impact |
| Rising P95 / P99 latency | Hidden bottlenecks, saturation, noisy neighbors. | The app is slow sometimes. | Lower engagement and increased churn risk. |
| Increased error rate under load | Service retries, timeouts, cascades. | Failed actions, broken flows. | SLA breaches. |
| CPU / DB saturation | Scaling limits, inefficient queries. | Gradual slowdown. | Support load, firefighting. |
| Late or failed auto-scaling | Poor scaling signals or cooldowns. | Sudden performance drops. | Lost deals and brand damage. |
| Queue lag increase | Consumers saturated / retries / slow workers | Actions complete late | Churn + trust loss |
| Per-tenant latency divergence | Noisy neighbor / skewed data | Some customers always slow | Enterprise escalation + churn |
Unique Performance Challenges in SaaS Applications
SaaS applications make it possible to operate 24X7 without downloading any application to the device. However, achieving this feasibility comes with unique performance challenges that you must address to ensure peak performance of your SaaS application.
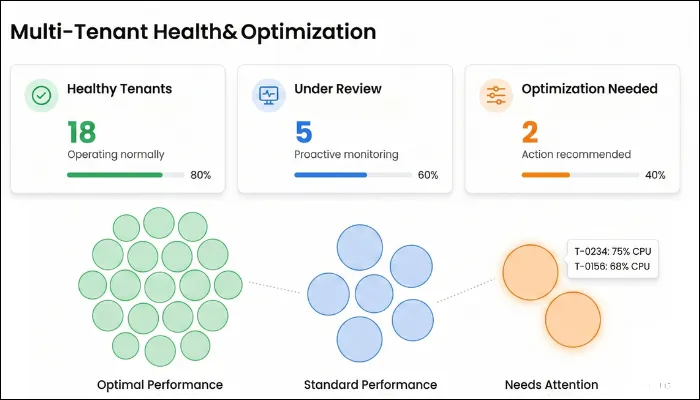
Multi-Tenancy & Tenant Isolation
In a SaaS model, multiple customers share the same app and infrastructure, making performance inherently fragile unless properly tested. One high-usage tenant can consume disproportionate CPU, memory, or database resources, unintentionally slowing others. Studies on shared cloud environments show that resource contention can introduce unpredictable latency when isolation is weak. As a result, you need to ensure that your SaaS performance testing validates fair resource allocation and tenant isolation.
How to test:
- Run load with a skewed tenant mix (e.g., top 5% tenants generate 40–60% of traffic) and include a “heavy tenant” burst while others run steady.
- Inject resource hog scenarios (large report/export, bulk import, expensive search) for one tenant and verify other tenants remain stable.
What to monitor:
- Per-tenant p95/p99 latency (by tenant ID)
- Per-tenant error rate (4xx/5xx/timeouts)
- CPU/memory saturation on shared services
- DB connection pool usage + query time by tenant tag
- “Noisy neighbor” indicators (tenant latency variance / drift)
Pass/Fail signals:
- PASS: Non-heavy tenants stay within SLO while heavy tenant spikes; tenant latency variance stays within an agreed threshold (e.g., <2× drift vs baseline).
- FAIL: One tenant’s burst causes cross-tenant p95/p99 breaches, rising timeouts, or shared DB pool exhaustion affecting multiple tenants.
Elastic Scaling
Auto-scaling is central to SaaS reliability, but it’s not foolproof. Scaling decisions depend on signals that may not reflect real bottlenecks. Moreover, cold starts can add seconds to the delay before new instances are ready, hurting user experience during sudden spikes. You also need to validate whether scaling up or scaling out sustains performance under real traffic. Cloud providers recommend load-testing auto-scaling policies due to misconfigured scaling frequently failing under pressure.
How to test:
- Run a spike ramp (e.g., 10× traffic in 2–5 minutes), validate scale-out + warm-up, then repeat with different cooldowns/thresholds.
- Test both scale-up and scale-down (sustained high load → return to normal) to catch oscillation and slow recovery.
What to monitor:
- Time-to-scale (time from spike start to new instances ready)
- p95/p99 latency + error rate during spike and recovery
- Instance/container warm-up time (cold start)
- Throttles/limits (API gateway, LB, managed services)
- Autoscaling events vs performance timeline (correlation)
Pass/Fail signals:
- PASS: p95 returns within SLO within 5 minutes (or your agreed recovery SLO) after scaling starts; no sustained 5xx burst after scale-out.
- FAIL: Scaling triggers too late, oscillates, or system remains above SLO for prolonged time; repeated throttling or backlog persists after traffic normalizes.
Database Saturation
If you ever felt high server resource usage and slow query logs, even if CPU or memory usage elsewhere appears normal, then it’s a clear sign of database saturation. In most cases, it begins with connection pools filling faster than they drain, followed by slow queries stacking up. As datasets grow, previously acceptable query plans and indexes degrade, leading to increased I/O and blocking behavior.
How to test:
- Execute load with production-like data volumes and include “DB-heavy” flows (search, reporting, exports, billing jobs).
- Run a scenario that gradually increases concurrency until throughput flattens (to identify DB bottleneck onset).
What to monitor:
- DB CPU, I/O, locks/waits, replication lag (if used)
- Connection pool utilization + queue/wait time
- Slow query count + top N query durations
- p95/p99 latency for DB-dependent endpoints
- Error rate/timeouts correlated to DB waits
Pass/Fail signals:
- PASS: Under peak load, DB metrics stay below saturation thresholds and p95/p99 remain within SLO without timeouts.
- FAIL: Connection pool exhaustion, lock contention, rising slow queries, or p95/p99 SLO breaches tied to DB waits/IO spikes.
Cache Inefficiency
Caching, one of the primary ways to improve application speed, is an effective way to boost your SaaS application's load time. However, the same can become a silent liability. Due to high popularity, many SaaS systems rely heavily on in-memory caches for session data, permissions, configuration, and frequently accessed objects. Problems occur when cache keys are poorly designed. A cache miss under load shifts pressure back to the database or downstream services. Stale or inconsistently invalidated cache entries introduce another form of degradation, where users receive outdated data despite fast responses.
How to test:
- Run load with realistic read patterns, then force cache expiry or rotate hot keys to simulate “cache miss under load.”
- Trigger a stampede scenario (many concurrent requests for same key after expiry) and validate protection (locks, request coalescing).
What to monitor:
- Cache hit rate / miss rate (overall + by key group)
- Cache latency (p95/p99) and eviction rate
- DB load increase during cache misses (CPU/queries/IO)
- p95/p99 latency for cached endpoints
- Error rate/timeouts during expiry events
Pass/Fail signals:
- PASS: Cache hit rate remains stable under load; cache expiry does not cause DB spikes that push p95/p99 over SLO.
- FAIL: Cache miss waves cause DB CPU spikes, thundering herd behavior, or sustained SLO breaches after key expiry.
Queue Backlog
Queues allow SaaS systems to scale by decoupling user actions from background processing, but they also introduce time-based performance risks. When producers generate jobs faster than consumers can process them, the queue depth increases, delaying execution beyond user expectations. Retries can worsen the situation by reintroducing failed work. From the user’s perspective, actions appear successful but are completely unpredictable or too late to be useful. Performance testing must validate not just queue throughput, but how quickly work moves end-to-end under sustained and bursty load.
How to test:
- Generate background jobs faster than consumers (controlled) to validate throughput limits and drain behavior after peak ends.
- Test burst + sustained load with retries enabled to observe whether retries create runaway backlog.
What to monitor:
- Queue depth (backlog) and message age
- End-to-end job latency (enqueue → completion)
- Consumer throughput (jobs/sec) and failure/retry rate
- Worker autoscaling trigger timing vs backlog growth
- User-visible impact (delayed emails, delayed reports, delayed webhooks)
Pass/Fail signals:
- PASS: Backlog grows predictably during bursts and drains to baseline within the agreed queue SLO window (e.g., ≤15 minutes after traffic stabilizes); end-to-end job latency remains within SLO.
- FAIL: Backlog keeps growing, message age increases continuously, retries amplify load, or business-critical jobs breach SLO (e.g., “export ready” too late).
Rate Limiting & Third-Party Dependencies
There is no denying that external services make the overall software more efficient and functional. After implementation, each service enforces its specific limits, and when those limits are reached, your application faces a delay. If rate limiting and backoff strategies aren’t exercised under load, it can amplify latency across unrelated features, hampering the overall performance of your SaaS application. Even though the performance risk here is indirect, it is still severe and can increase your app's churn rate.
How to test:
- Simulate vendor throttling (429s) and higher latency; validate backoff with jitter and graceful degradation of non-critical features.
- Run load across multiple tenants to confirm per-tenant budgets (one tenant hitting limits doesn’t throttle everyone).
What to monitor:
- 429/503 rates and retry counts (per dependency)
- Dependency latency (p95/p99) and timeouts
- Circuit breaker / fallback activation rate
- Overall p95/p99 impact on primary workflows
- Queue/async fallback behavior if dependency is down
Pass/Fail signals:
- PASS: Throttling is contained (no retry storm), primary workflows remain within SLO or degrade gracefully, and per-tenant isolation prevents global impact.
- FAIL: Retry storms amplify failures, dependency issues cascade into core flows, or multiple tenants experience SLO breaches due to shared limits/keys.
Performance Testing Types for SaaS
There are tons of performance testing types that you can run on your application. But performance testing in SaaS isn’t about running every possible test type solely because it exists. Each type serves a specific business and operational purpose. The mistake many teams make is jumping straight to heavy load or stress tests without first understanding what normal even looks like for their product.
With that in mind, the following are the various performance testing types for SaaS that you need to perform.
Baseline Performance Testing
Before moving to extensive or heavy testing, perform baseline testing to get a clear picture of how your application behaves under expected conditions.
For a SaaS application, baseline testing involves:
- Average daily user concurrency.
- Common workflows include login, dashboards, CRUD operations, and API calls.
- Typical tenant mix.
- Normal data volumes.
While the goal of most testing types is to break the system, baseline testing establishes a trusted reference for response times, throughput, error rates, and resource usage when everything is operating as designed.
Without a baseline, you may misinterpret results, as it eradicates the ambiguity and allows you to answer a simple but critical question: Is the system behaving the way it should today?
Load Testing
Upon understanding what normal looks like, it's time for you to explore SaaS load testing, where you’ll understand how the system behaves as usage increases within planned or expected limits.
Here, load testing must reflect tenant diversity. A realistic load doesn’t just increase user count, but it also increases behavioral complexity. There are situations in which some tenants log in frequently, others generate reports, some rely heavily on APIs, and a few consume disproportionate resources.
With multi-tenant load testing, you can determine whether the platform can sustain this growth without uneven performance across tenants or breaking SLA commitments. By understanding your SaaS system's load-handling capabilities, you gain confidence that growth will not quietly erode user experience. In addition, it unveils the parts that become sensitive first, allowing you to address bottlenecks before customers feel them.
Stress Testing
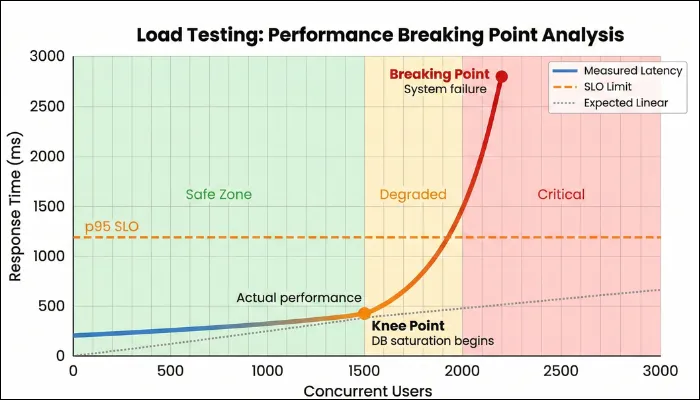
While load testing focuses on the load-bearing capacity of your SaaS application, stress testing takes it a step further by identifying the software's breaking point. Here, you will deliberately push your app beyond its intended limits to reveal its breaking point. Keep in mind that your motive isn’t to prove that the system fails, as every system has limitations. Your motive is to identify how it fails and how contained the failure is.
In a multi-tenant SaaS environment, a single overloaded component can cascade into degradation if safeguards are weak or nonexistent. Stress testing shows you which services fail first, whether failures are graceful or chaotic, and how the systems behave when pressure is released. Does performance recover automatically, or does the system require manual intervention? By getting these answers, you can plan incident response, enabling you to bring your SaaS app back up quickly after any crash.
Spike Testing
SaaS software often experiences sudden, unannounced traffic surges. Spike testing allows you to prepare for such scenarios by suddenly increasing app traffic for a specific period and then returning it to normal. The intent here is to observe how quickly the platform reacts and whether users experience delays or failures before scaling mechanisms kick in.
When performing spike tests, pay close attention to response-time spikes, error rates, and scaling behavior. After performing stress testing, you can determine whether your SaaS can handle sudden demand smoothly or if users will experience immediate disruption during high-visibility moments.
Soak Testing
Your application will not face maximum load all the time. To prepare for regular traffic and understand how your app performs, you need to run soak tests, also known as endurance testing. In always-on SaaS platforms, memory leaks, connection exhaustion, queue accumulation, database degradation, and other issues often appear after hours or days of continuous operation.
In this test, you run the system under sustained, realistic use for an extended period to uncover issues that develop gradually. Soak testing helps you detect these patterns before they affect customers. While conducting this test, you should monitor:
- Steady weekday traffic from many tenants, plus periodic bursts.
- Continuous creation, update, and deletion of tenant data to simulate a real lifecycle.
- Ongoing background tasks include indexing, compaction, analytics, email sending, and webhook dispatching.
The next part is to track memory trends, queue depth, and average lag for tenant-critical jobs, database behavior, and per-tenant performance drift.
Resilience Testing
Testing isn’t limited to how the system breaks, but also emphasizes the recovery capabilities of the SaaS platform. And evaluating recovery mechanisms involves resilience testing. Instead of abstract chaos testing, you design scenarios rooted in SaaS realities, such as:
- Simulate losing a primary region or key AZ and observe cross-region failover for compute, DB, cache, and storage, including DNS/traffic routing and session continuity.
- Deliberately break a shared dependency for a subset of tenants to check isolation and blast radius.
- Break down third-party dependencies and verify that your app degrades gracefully rather than crashing workflows.
With this testing, you can determine whether failover mechanisms work as intended and how performance is affected during recovery. In addition, by running resilience tests, you learn how quickly the system stabilizes after failures and whether performance remains within acceptable bounds during degraded conditions. The insights you gain from this testing are exceptionally valuable for platforms with global users or strict availability commitments.
Performance Regression Gates (CI/CD)
Performance testing is most effective when it runs continuously, not only before major releases.
- PR checks (5–15 minutes): API micro-load for critical endpoints + SLO thresholds (fail-fast).
- Nightly (60–120 minutes): load + limited soak + trend comparison vs baseline.
- Pre-release (half-day to 1 day): full load + spike + resilience scenarios + evidence pack.
- Pre-peak events (Black Friday / billing runs): region latency + CDN validation + burst + queue drain tests.
Output: evidence pack (dashboards, traces, test configs, thresholds, and pass/fail summary).
Metrics that Matter in Performance Testing
When it comes to measuring how your app is performing, there is no better way than evaluating through metrics. The focus should be on a small set of indicators that reveal how your platform behaves under load and over time. The following section is divided into two parts: core metrics that involve common metrics across different app types and SaaS-specific metrics that focus on dedicated metrics to SaaS apps.
Core Metrics
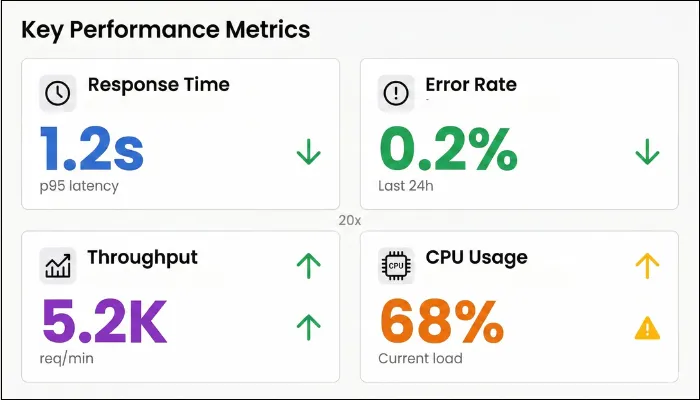
The first is core metrics that involve response time, throughput, error rate, and saturation.
- Response Time: Latency percentiles show how performance is distributed across users. The median (p50) reflects typical experience, while p95 and p99 expose the long-tail delays that usually trigger frustration and churn. During tests, p95 or p99 values often signal shared resource contention or uneven tenant behavior. Set p95/p99 targets per journey (e.g., login, search, export). Many teams start with p95 ~1–2s for interactive flows, but SLOs should match product expectations and user tolerance.
- Throughput: You need to know how much work your SaaS platform can handle at a time, and throughput helps you identify that. Throughput should scale smoothly as load increases, not flatten suddenly or oscillate unpredictably. You need to observe how much additional load results in a proportional increase in work completed. If throughput stalls while request rates continue rising, you have reached a bottleneck.
- Error Rate: A single 5xx error might not break the application, but 1% across thousands of tenant requests turns into a churn machine. To ensure that doesn’t happen, log every 4xx/5xx and timeout at your gateway, slicing by tenant and flow. When load testing, anything over 2% screams saturation or retry storms.
- Saturation: Saturation metrics are your early-warning system as they showcase stress before your users experience it. Sustained CPU above safe thresholds, memory that never stabilizes, frequent garbage collection pauses, or thread pools operating at capacity all indicate that performance headroom is disappearing.
Also Read: Top 10 performance testing considersation
SaaS-Specific Performance Metrics
The next category is SaaS-specific performance testing, and they matter because SaaS systems are shared and sensitive in ways traditional applications are not:
- Per-Tenant Latency: Tracking performance per tenant helps you see whether degradation is evenly distributed or concentrated. Large gaps usually indicate noisy-neighbor problems or uneven data access patterns.
- Cost Per Tenant/Cost Per Transaction: A SaaS platform that scales but becomes increasingly expensive to run is heading toward trouble. By correlating performance test results with infrastructure usage and billing data, you can see whether higher load translates into efficient growth or disproportionate cost. Rising transaction costs often expose hidden inefficiencies.
- Queue Depth: Queues absorb pressure without immediately impacting user-facing APIs, which makes them dangerous. During realistic testing, temporary queue growth is normal. What matters is whether that backlog drains once traffic stabilizes. The problem arises when you notice increasing lag or persistent depth.
- Cache Hit Rate: Cache hit rate tells you how much unnecessary work your system is doing. High hit rates mean requests are served quickly and cheaply, whereas low hit rates push load toward databases and services that scale poorly.
- Autoscaling time-to-stable (TTStable): time from spike start until p95 returns under SLO.
- Per-tenant error budget burn: how fast each tenant consumes its allowed errors/latency breaches during load.
Workload Modeling for Multi-Tenant SaaS Platform
When executing performance tests, you need to create a test. Workload modeling is the process of creating scenarios to evaluate the overall performance of your SaaS application. The process involves creating production-like conditions in the test environment. Workload modeling involves building a tenant-mix workload model and a test data strategy.
Build a Tenant-Mix Workload Model
In a multi-tenant SaaS app, performance is defined by who is using the platform at the same time, not by an average user profile. Different tenants place very different demands on shared resources, and a small number of heavy tenants often drive most of the load. When you have a tenant-mix workload, you have a model that captures the imbalance so your performance tests reflect how the platform is used in production.
- Consider Different Tenant Tiers: The first thing you need to do is group the tenants based on how they use the platform. Small tenants generate light traffic, medium tenants are comparatively consistent, whereas enterprise tenants tend to create higher concurrency and larger data footprints. Your workload models should accurately reflect these behavioral differences rather than treating all tenants equally.
- Traffic Distribution: Most SaaS platforms follow an uneven distribution, with a small percentage of tenants accounting for a large share of the total load. Your top 20% of tenants often drive 80% of the load, especially during coordinated peaks like payroll runs or fiscal closes. Your tests should intentionally reflect this skew. When traffic is evenly distributed across tenants, you miss the conditions that trigger noisy-neighbor issues and shared resource contention.
Example tenant mix model (sample):- 70% small tenants: low concurrency, read-heavy
- 25% mid tenants: steady usage + periodic reports
- 5% enterprise tenants: high concurrency + heavy exports/imports
- Burst layer: one enterprise billing run burst every hour
- Peak Hour Patterns: A viral feature launch, competitor outage, or Black Friday promo can 10x traffic in minutes. Peak hours often align with business activity, while burst events come from scheduled reports, billing jobs, or batch processes. You should layer these bursts on top of steady user traffic to see how the system behaves when multiple heavy operations collide.
- Read vs Write Mix: The read-write balance in SaaS is not constant. Most platforms are read-heavy during normal usage but experience write-heavy spikes during imports, updates, or workflow execution. Varying this mix in your workload model helps you understand how write pressure affects the overall system's responsiveness.
- Data Volume Effects: Data size changes everything. Reports and exports that perform well on small datasets can degrade sharply as tenant data grows. Considering operations that run against large datasets allows you to observe how performance evolves with scale.
Test Data Strategy
Even the most accurate workload model can yield misleading results when run on unrealistic data. A sound test data strategy ensures that your performance tests reflect real-world conditions rather than creating false confidence.
- Production-Scale Data: Many performance problems only surface when tables grow large or queries operate on real-world distributions. Your test data should mirror production volume and structure to eradicate a false sense of safety and accurately depict what’s happening.
- Privacy-Safe Masking: Remember that privacy can’t be an afterthought. While creating workload mode, you should always protect sensitive information while preserving data structure and relationships, and the ultimate goal becomes safety without sacrificing realism.
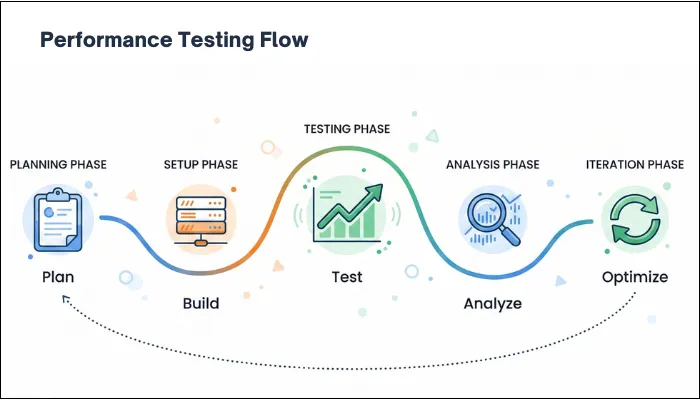
Step-by-Step SaaS Performance Testing Process
To ensure that your SaaS performance test works efficiently, it is advised to follow a clear flow. When you skip steps or do them out of order, you increase the possibility of misleading results. The steps below are designed so you can execute them end-to-end, even when performing performance testing with a small team.
- Define Critical User Journeys: You understand that not every screen deserves the same level of scrutiny. With that in mind, it's crucial that you decide what directly impacts revenue, retention, commitments, or user experience.
In other words, you need to define critical user journeys that matter and prioritize them. Once those journeys are clear, define service-level objectives using latency percentiles rather than averages.
You can assign hard SLOs, such as p95 should be under 1.2 seconds for baseboards, p99 under 3 seconds for exports, errors below 0.3% end-to-end, and more.
Output: SLO table + critical journeys list
- Select Environments Close To Production Parity: Performance results are inseparable from the environment they come from. Differences in instance sizes, autoscaling limits, network paths, or managed service quotas can render conclusions invalid. Before running any tests, review how closely the environment matches production.
Monitoring instance types, autoscaling policies, network configurations, database limits, and managed service quotas is a crucial step in the process. In addition, you need to document whenever something is scaled down or simplified.
Output: environment parity checklist
- Instrument Observability: With instrument observability, you can diagnose unknown issues and complex systems.
Additionally, you can understand the software's internal state, allowing you to establish a baseline and a depiction of what you can expect from testing.
Logs, metrics, and traces are some of the key components of instrumentation, providing you with faster debugging, enhanced collaboration, proactive bug detection, and better bug coverage.
Output: dashboards + tracing coverage - Create Test Scripts: Executing performance tests requires a detailed flow so that you don’t fall into the trap of what to do now. Test scripts are flows that involve defined instructions based on real-world user behavior to simulate user behavior and monitor the results.
One thing you need to keep in mind is avoiding static inputs and hard-coded flows. Instead, introduce parameterized data that reflects different users, tenants, and data sizes.
Output: scripts + data strategy doc
- Run Baseline and Different Tests: Once your test scripts are ready, how you run the tests matters as much as the tests themselves. You don’t throw maximum traffic at the system all at once.
You begin with a baseline to understand how the application behaves under normal usage, and then use it to compare with other tests.
From there, you gradually increase load to expected peak levels and observe how response time, errors, resource usage, and other metrics evolve.
Follow that up with stress and spike tests, and push the system beyond its comfort zone. It's up to you whether you want to push the system suddenly or gradually, but the goal is to reveal its limits and its reaction behavior.
The last part in this step is to perform soak testing to keep the pressure steady over time and identify issues that only emerge after hours of continuous use.
Define stop/go criteria: if p95 breaches SLO by X% or error rate exceeds Y%, stop and diagnose before increasing load.
Output: run plan + gates
- Analyze Bottlenecks: Now that you’ve executed tests, it's time to understand what the outcome means. A spike in response time or errors rarely stands alone, so you need to read the data together.
For that, you start by lining up latency, throughput, error rates, and resource metrics on the same timeline and identifying where behavior first changed.
You can use baseline and traces to follow slow requests through the system and see which service or dependency started delaying the flow.
At the same time, check other metrics to determine whether the slowdown was caused by resource contention or downstream dependencies.
Output: bottleneck report with evidence
- Apply Fixes and Repeat: Once you identify the real cause of the slowdown, the next step is to make targeted changes based on the issue and verify that they work. Once the fix is applied, you rerun the exact same tests using the same workload and data so results are comparable. You look for concrete improvements such as reduced tail latency, delayed saturation, faster recovery, and fewer cascading failures.
Output: regression baseline update
Common Bottlenecks in SaaS Performance Testing and How to Fix Them
Most SaaS systems show bottlenecks once you test with realistic tenant skew, data volumes, and burst patterns. In most cases, you’ll find your app has various performance issues that require appropriate diagnosis and fixes. Considering that fact, the following table explains some of the major bottlenecks that can hamper the overall user experience:
| Bottleneck | Symptoms | Root Cause | Fixes |
| Database Connection Pool Exhaustion | p95/p99 latency spikes to 5+ seconds, DB wait times dominate traces, and 500 errors during load tests. | App instances open too many concurrent connections, while long-running queries tie up entire pools. | Cancel queries that run over 30 seconds, and route reporting queries to read replicas. |
| Cache Thundering Herd | Database CPU spikes 10x when popular keys expire. p99 latency jumps from 300ms to 3+ seconds. | Dozens of requests simultaneously miss the same expired cache key, and all hit the database at once. | Implement cache stampede protection with leased locks. |
| Memory Leaks | Heap usage climbs steadily over time. OOM kills occur after 12-24 hours of load. | Objects fail to garbage collect properly. | Run heap dumps during soak tests, and validate that 48-hour soak tests pass cleanly. |
| Queue Backlog | Email delivery delays 2+ hours. | Worker autoscaling reacts too slowly to queue buildup, while retry storms amplify transient failures. | Auto-scale workers based on queue depth instead of CPU, and add per-tenant priority lanes. |
| Third-Party API Throttling | 429 errors cascade through tenant workflows. Integration failures occur during peaks. | A single API key shared across tenants exceeds vendor limits, while naive retry logic worsens throttling. | Set per-tenant API budgets, and implement exponential backoff with jitter. |
| N+1 Query Problem | 100+ database queries are executed per request, and page loads slowly despite simple operations. | Nested loops fetch related entities individually with no batching occurring. | Denormalize hot paths, and monitor query counts per trace ID. |
| Noisy Neighbor Hot Tenant | only some tenants slow; p95/p99 diverges by tenant; shared DB CPU spikes during one tenant’s heavy job | shared DB/CPU contention; missing per-tenant quotas; heavy tenant workloads not isolated | per-tenant quotas & rate limits; priority lanes; isolate heavy jobs; move reporting to replicas; introduce noisy-neighbor detection alerts |
| Noisy Neighbor Hot Tenant | instance count oscillates; latency spikes repeat; p95 never stabilizes during sustained load | bad scaling signals, cooldowns too aggressive, warm-up too slow, scaling based on CPU instead of true bottleneck | tune thresholds/cooldowns; scale on queue depth or request rate; add warm pools; validate with spike + recovery tests |
Tools for SaaS Performance Testing
Choosing performance testing tools for SaaS should be focused on finding the right fit for your architecture, workflow, scale, and other requirements. No single tool covers every aspect, and you need to combine different tools for their capabilities. The following is a list of top tools that you can pick from:
Load Generation Tools
Load generation tools simulate users, tenants, APIs, and background activity. The key decision here is not raw load capacity, but how closely the tool allows you to model real SaaS behavior.
- JMeter: With extensive protocol support and a mature ecosystem, JMeter is one of the primary choices as a load generation tool. IT supports HTTP/HTTPS, REST, SOAP, JDBC, FTP, and several other products, making it suitable for platforms that involve APIs, background processing, and integration-heavy workflows. In addition to that, it offers:
- Thread-based concurrency model for simulating users and requests.
- Rich set of samplers, timers, assertions, and listeners.
- Built-in support for correlation, parameterization, and dynamic data handling.
- Large plugin ecosystem for extended reporting and protocol support.
- k6: Developed by Grafana Labs, k6 is an open-source tool designed around the idea that performance tests should be treated as code. In this tool, tests are written in JavaScript, making them easy to version and evolve alongside application code. As k6 emphasizes simplicity and speed, it is especially effective for API-centric SaaS platforms where tests need to be executed frequently and consistently. Other pivotal features of this tool include:
- Event-driven execution model suitable for high concurrency.
- Strong support for API testing with clear request and response handling.
- Built-in metrics for latency percentiles, throughput, and error rates.
- Native integration with CI/CD pipelines and modern development workflows.
- Gatling: Gatling focuses on high-performance load generation and precise control over user behavior. It uses a code-based approach built on Scala, allowing detailed modeling of complex user journeys. Gatling is often chosen when SaaS platforms need to simulate large-scale concurrency with strict control over how users ramp up and interact with the system.
- BlazeMeter: BlazeMeter, a cloud performance testing tool, is often chosen when teams want cloud-scale load without being locked into a single cloud provider. It supports global traffic generation across multiple regions and remains compatible with JMeter scripts, making it attractive for teams already invested in JMeter but constrained by local infrastructure. BlazeMeter is particularly useful when validating global SaaS performance, CDN behavior, or regional latency differences before a major launch.
Observability Tools
Load testing without observability tells you that something slowed down, without any explanation. Using observability tools, you can turn performance tests into actionable insights. Here are the top options you can consider for your SaaS application.
- Datadog: Datadog is widely used in SaaS environments because it provides a single, correlated view of application performance, infrastructure metrics, logs, and traces. With its distributed tracing, you can follow requests across services, while real-time dashboards make it easier to spot saturation and scaling behavior during performance tests. Its strength lies in fast diagnosis, especially in cloud-native and containerized SaaS architectures.
- Dynatrace: Dynatrace focuses on deep, automated observability for complex SaaS systems, particularly those built on microservices and cloud-native infrastructure. It automatically maps service dependencies and execution paths, which makes it easier to understand how performance issues propagate under load. Key features of this tool include:
- Automatic discovery of services, processes, and dependencies.
- End-to-end distributed tracing without heavy manual instrumentation.
- AI-assisted root-cause analysis that correlates performance issues with configuration changes.
- Built-in support for performance baselining and anomaly detection.
- OpenTelemetry (OTel)
- Grafana + Prometheus
Pick tools based on how well they model tenant identity, token refresh, API quotas, and background processing.
SaaS Performance Testing Checklist
Having a checklist by your side can give you a quick overview of what to do and ensure you never miss a detail or step. With that in mind, here is a SaaS performance testing checklist designed to help you plan, execute, and validate SaaS performance testing systematically.
- Define clear SLOs using p95 and p99 latency for each critical user journey and API.
- Identify and prioritize workflows that directly affect user experience, revenue, or SLAs.
- Model a realistic tenant mix that includes top-heavy usage tenants and the long tail of smaller ones.
- Validate rate-limiting behavior and retry logic under load to avoid retry storms.
- Confirm autoscaling thresholds, scale-out triggers, and instance warm-up times.
- Use test data volumes and distributions that closely match production reality.
- Verify that large data operations, such as reports, exports, and analytics, are included.
- Establish a baseline before increasing load to understand normal system behavior.
- Run load, stress, spike, and soak tests in a deliberate sequence.
- Measure queue depth and processing lag during peak and sustained load.
- Track CPU, memory, database connections, I/O, and other saturation indicators.
- Monitor per-tenant latency and error rates to detect noisy-neighbor issues.
- Correlate performance changes with scaling events and dependency behavior.
- Re-test after optimizations to confirm measurable and repeatable improvement.
- Define CI performance gates (PR vs nightly vs release)
- Capture an evidence pack (dashboards, traces, configs, thresholds)
- Validate tenant fairness (per-tenant latency/error divergence)
- Validate cost guardrails (cost/txn under peak)
Conclusion
When you work on a SaaS product long enough, you realize that performance issues are rarely sudden surprises. They build up quietly as tenants grow. What performance testing gives you is not just numbers, but visibility. You begin witnessing how your system behaves when things are normal, when they are busy, and when they are stretched in ways production will eventually reach.
If you test with realistic tenant mixes and real data volumes, performance stops being a last-minute concern and becomes part of how you make decisions. You know what will break first and its consequences, allowing you to prepare for it and eradicate every performance issue to give a seamless experience to the users.
However, as your SaaS platform grows, performance risks become harder to predict and easier for customers to notice. At this stage, surface-level testing might not suffice, and you need clarity on how the system behaves under real tenant load.
With the expert SaaS performance testing service, ThinkSys can help your SaaS application eradicate any performance issues before they reach production. Practical testing, clear findings, logical fixes, and peak performance are guaranteed when you partner with ThinkSys.
Who this guide is for
- CTO/VP Eng building multi-tenant SaaS
- QA leaders adding performance gates
- SRE/Platform owners of SLAs
If you want a SaaS performance baseline + tenant-mix workload model + CI performance gates with audit-ready evidence, ThinkSys can help.
Glossary (Quick Definitions)
- Tail latency (p95/p99): slowest 5% / 1% requests; where users feel “random slowness.”
- Noisy neighbor: one tenant’s load degrades others on shared infrastructure.
- SLO: performance target (e.g., p95 < 1.5s) for a workflow or API.
- Error budget: allowed failure amount before you pause risky releases.
- Saturation: resource limit reached (CPU, DB pool, I/O) causing cascading slowdowns.
- Cold start: warm-up delay when new instances spin up.
- Cache stampede: many requests miss the same key and overload DB/services.
- Retry storm: retries amplify traffic and prevent recovery.
- Queue lag: time from job enqueue to completion; backlog health signal.
- Backpressure: controlling intake when downstream systems are overloaded.
Share This Article:


