QA ROI: A Practical Guide to Measuring Testing Cost, Risk, and Value
Summarize With:

Sumukhi Sharma
When a CTO or Head of Engineering at a mid-size SaaS company comes to us for a QA audit, we almost always find one of two things. Roughly seven out of ten teams are overspending and don't know where the money is going. The rest track one or two QA metrics and treat that as the complete ROI picture.
In both cases, we run the same audit, mapping QA spend and risk across five cost categories. After realigning spend against what we find, teams typically recover the equivalent of 1.5× their prior QA ROI, and later in this guide, we walk one anonymized company through all five categories to show exactly how that number is built, not just asserted.
This article gives you the exact measurement, benchmark, and cost example for each category, the same ones we use in a paid engagement, so you can run a first-pass version yourself this week.
Get the Free 5-Category QA ROI calculator
The 5 Questions That Reveal Your Software Testing ROI
If you can't answer these with exact numbers, your QA budget is leaving without a return you can name.
1. What are your production bugs actually costing you?
Most teams know their defect count. Fewer know what each production incident costs in engineering time, delayed releases, and SLA penalties combined.
We pull 90 days of incident data and put a dollar figure on it. At a typical $15M ARR SaaS company with 80 monthly deployments and a 1.2% change failure rate (the percentage of deployments that cause a production incident), that quarterly total runs $400-500K before penalties.
Teams are almost always surprised by that number. If your team can't state it on demand today, that's the first thing we'd flag.
2. Do you track AI-written code and human-written code separately for failures?
One blended change failure rate hides two things that fail at different rates, and per DORA's 2025 report, high-AI-adoption teams saw stability regress even as throughput improved. AI-generated code tends to cluster around similar patterns, so one bad assumption propagates across more paths than a human engineer would produce in the same timeframe. One aggregate number means the instability is hidden from every dashboard in your org until it surfaces in production.
3. How much of the code you shipped this sprint has no test coverage?
Aggregate coverage tells you about existing code. Only sprint-over-sprint drift tells you whether this week's code got tested. Top-quartile QA teams spend 18-20% of the IT budget on QA. Bottom-quartile teams spend 32-40%. The 14-point spread reflects how systematically each team tracks whether new code is getting covered.
If your team can't answer this for the last sprint specifically, coverage is falling behind your release cadence without anyone noticing.
4. Can your team name the assumptions your test suite has never tested?
High coverage does not mean you are testing the right things. Coverage measures which code paths ran. It does not measure whether you tested the assumptions behind those paths. CrowdStrike's August 2024 outage ~$5.4B in Fortune 500 losses, is what this gap looks like at scale.
If your team cannot produce a named list of assumptions the current suite has never exercised, and you are in the same structural position.
5. Could you produce your QA documentation trail for an auditor today?
For healthcare SaaS teams, this is moving from best practice to regulatory requirement. The HIPAA Security Rule NPRM (a proposed rule that, when finalized, would require annual technical testing of systems handling patient data), published January 6, 2025, is turning QA documentation into a compliance artifact. If the trail cannot be produced on demand, the exposure is $10.93M average per healthcare breach and potentially a regulatory violation under a rule that is already in proposed form.
Each section below covers one category: what we find when we audit it, how to measure it yourself in a few hours, and what it costs to leave it unmeasured.
1. Production Incident Costs
Defects caught in production cost 5-30× more to fix than defects caught in development, and most teams undercount the total by 20-40% because it's spread across three budgets that never get added together.
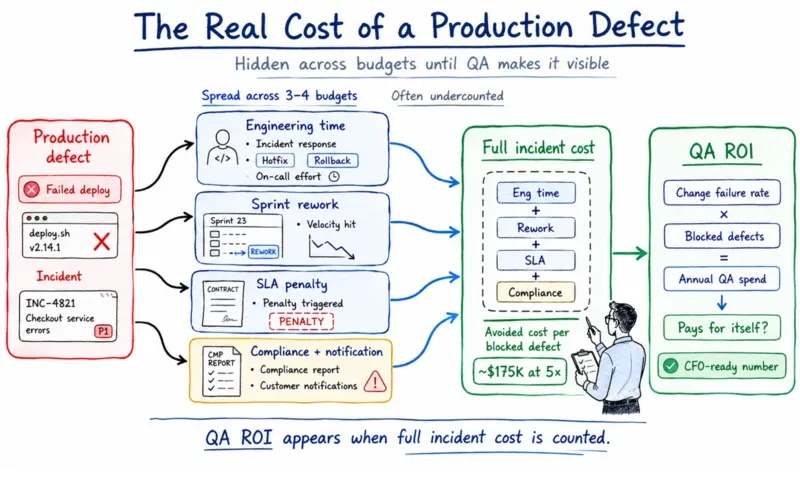
Failed deploys go to engineering time. Rework disappears into sprint velocity. SLA penalties go to contracts. No one assembles the number, so no one can answer the question we ask in every audit: at what change failure rate does your annual QA spend pay for itself?
The high end of that 5-30× range applies to regulated industries where remediation includes compliance reporting and customer notification. At the conservative 5× escalation, the avoided cost per blocked production defect is roughly $175K per event. Once the quarterly number exists, the CFO conversation shifts from cost defense to projected ROI.
How to run this yourself
- Pull your last 90 days of P1/P2 incidents, failed deploys, and emergency rollbacks.
- For each, estimate total engineering hours at your fully loaded rate (salary + benefits + overhead, typically $150–200/hr for a senior engineer).
- Add any SLA penalties that those incidents triggered.
- Sum to a quarterly total. That is your quarterly production incident cost.
- Divide by your annualized QA spend. Above 2.0 = the investment is clearly self-justifying. Below 0.5 = costs are being absorbed elsewhere and your number is incomplete.
How ThinkSys approaches this:
What changes when we run the audit is where the data comes from and what happens next.
- Most teams undercount by 20-40% because incident costs live across engineering, customer success, and contracts simultaneously. We pull across all three before drawing any conclusions.
- The thresholds above 2x and below 0.5x come from running this calculation across dozens of audits at similar ARR bands. We use them as diagnostic triggers.
- Every scope recommendation maps to a projected change in that cost line, turning "here's what QA costs" into "here's what QA prevents."
2. AI Code Instability Rate
If you have only one change failure rate number, you're blending AI-generated and human-written code that fail at different rates, and the instability stays invisible until it surfaces in production.
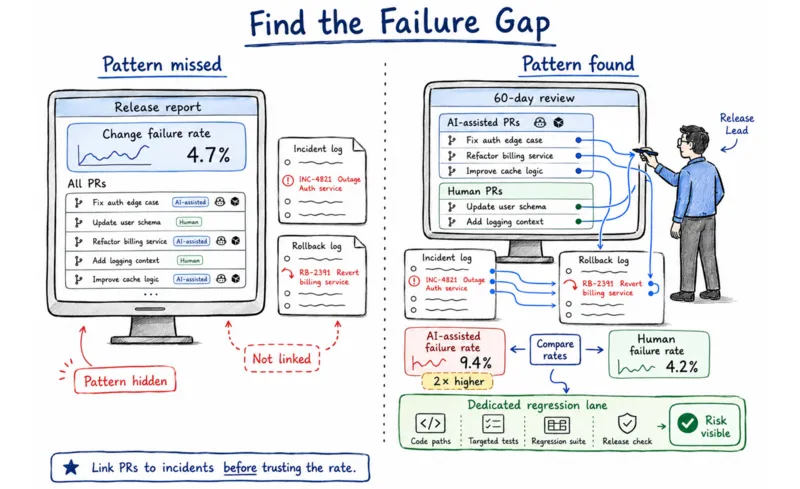
AI-generated code clusters around similar patterns, so one bad assumption propagates across more paths than a human engineer would produce in the same timeframe. When Satya Nadella disclosed at LlamaCon (April 2025) that 20-30% of Microsoft's code is now AI-generated, that's the scale at which blending becomes a measurement failure.
DORA 2025 formalized the split, making instability a separately tracked vector your board will increasingly reference. When the two rates diverge significantly, instability is structural and needs a dedicated regression lane, a suite built specifically for AI-generated code paths. When they converge, the aggregate is valid. Either way, you need both numbers to know which condition you're in.
How to run this yourself
- Identify which PRs in the last 60 days were AI-assisted. Most tools leave traces. Copilot and Cursor commits often carry signatures in PR descriptions or commit metadata.
- Pull your incident and rollback log for the same 60 days.
- Cross-reference: which AI-assisted deployments triggered a P1 or rollback?
- Calculate the AI-assisted failure rate (failures ÷ total AI-assisted PRs).
- Calculate the same rate for human-authored PRs.
- Compare the two. If the AI-assisted rate runs more than 2× the human rate, the divergence is structural and your aggregate is masking it..
How ThinkSys runs it:
- We tag AI-assisted commits by tool signature, which requires cross-referencing commit metadata with your tool stack. It takes two days when you don't have the tooling set up and two hours when you do. We set it up first.
- When we find the AI-assisted rate above 2x, we build a dedicated regression lane for AI-generated code paths before agreeing on any coverage targets. Testing AI code with a suite designed for human-authored patterns is what keeps the divergence invisible until production.
- We make the architectural decision before writing a single new test.
- Tracking that split also requires knowing which code paths your regression suite covers by code origin, which is where coverage drift becomes a separate measurement problem.
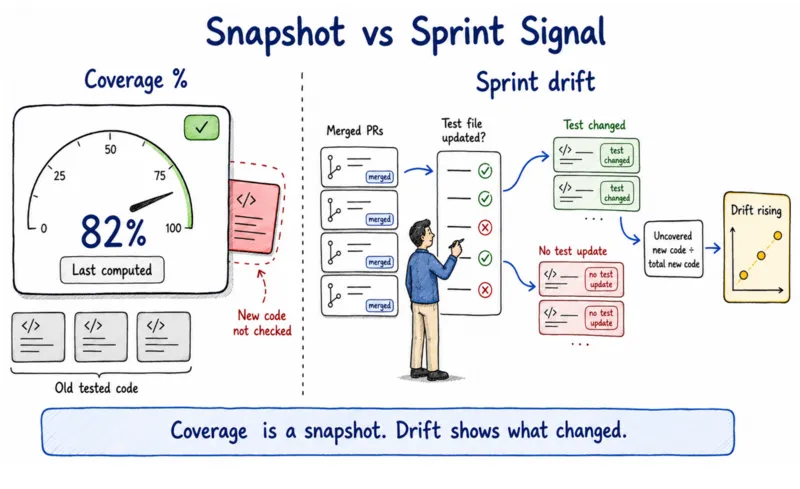
3. Regression Coverage Drift
Teams with high coverage percentages are often shipping uncovered code every sprint. Coverage percentage measures what was true when the metric was last computed. The drift rate measures what is happening right now, sprint by sprint. Those are two different things, and only one of them tells you whether your test coverage is keeping pace with the code you are shipping.
Capgemini's World Quality Report 2024-25 puts a cost on that gap. Top-quartile teams spend 18-20% of their IT budget on QA. Bottom-quartile teams spend 32-40%. The 14-point spread is not a spread preference. Bottom-quartile teams are paying for reactive triage because no one tracks whether new code is getting covered sprint by sprint. DORA 2025 shows the mechanism. Stability regressed in the high-AI-adoption cohort even when teams invested in test tooling. AI code volume outpaces coverage design when no one owns regression-suite architecture as a separate discipline.
How to run this yourself
- Take the last sprint's PR log.
- For each PR that merged to production, check whether a corresponding test file was added or modified in the same sprint.
- Count the net-new code that shipped with no test update alongside it.
- Divide by total net-new code shipped. That ratio is your sprint drift rate.
- Repeat for the three sprints before it. A rising trend means the gap is compounding. A stable non-zero rate means the coverage floor is not shrinking on its own.
How we do it at ThinkSys:
- In most codebases, 20% of modules produce 80% of the uncovered net-new code. We identify which ones before writing a single new test. That changes where test capacity gets allocated first.
- We distinguish between stable drift in a human-authored codebase, which is manageable, and accelerating drift under AI volume, which is a compounding condition requiring a different response.
- We assign a named owner to the regression-suite architecture as a discipline, separate from the people writing tests. That is the structural fix the Capgemini top-quartile teams have, and the bottom-quartile teams do not.
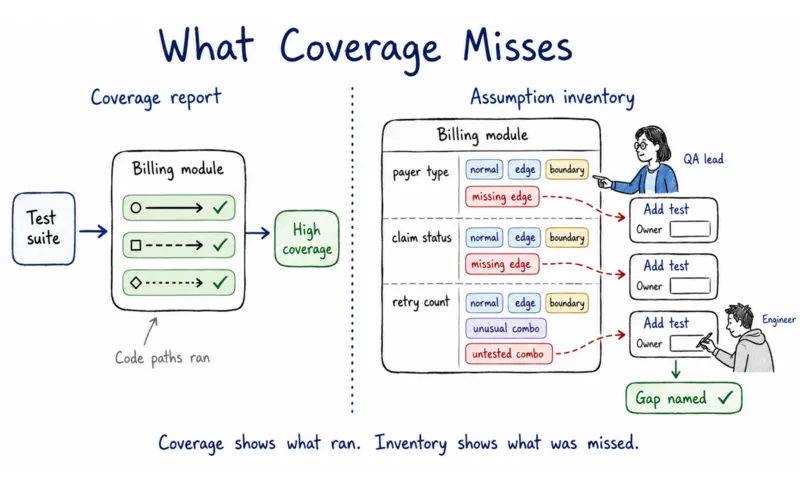
4. Test Design Coverage Depth
Coverage percentage counts how many code paths your tests ran. Tested assumptions are a different metric, and the gap between the two is where the most expensive defects hide.
Kent Beck, who created Test-Driven Development, draws the distinction clearly in Test Desiderata. He argues that each test must satisfy independent criteria, including behavioral accuracy and predictive value.
A test that exercises a code path against a wildcard assumption satisfies the first criterion but fails the second, because it does not represent the actual input space the system encounters in production.
CrowdStrike's Channel File 291 is the documented case. According to CrowdStrike's External Technical Root Cause Analysis (August 6, 2024), the defect was a parameter-count mismatch. 21 inputs arrived, where 20 were expected.
Multiple test layers passed the file because prior Template Instances had always used wildcards in that slot. The assumption was never stated or tested, and coverage appeared adequate. 8.5 million Windows endpoints entered recovery mode, and Fortune 500 losses reached approximately $5.4 billion.
Some engineering teams have concluded that pre-production coverage depth is economically irrational, that observability, feature flags, and fast rollback make it unnecessary. That argument, made most prominently by Charity Majors (co-founder and CTO of Honeycomb, one of the most cited voices on production observability), holds under specific conditions. Degradation tolerance must be acceptable, feature flags must cover every meaningful code path, and on-call teams must be able to detect and roll back within 10 minutes at p95. In US healthcare SaaS, a 12-minute payer-integration failure is a clinical workflow event.
How to run this yourself
- Pick the three modules where a defect would be most expensive.
- For each module, list every input parameter it accepts.
- For each parameter, write down which values your current test suite actually exercises. Normal ranges, edge cases, boundary values, unusual combinations.
- The gap between that list and the full range of values the system will encounter in production is your assumption inventory for that module.
- In most codebases, this takes about a day per module and surfaces two or three assumptions that no test has ever named.
What changes when we run it
- We map assumptions against your five highest-risk modules, not three, and we do it against the full parameter space documented in your API contracts and integration specs, sources most teams do not pull into test design.
- We look specifically for the ratio of implicit to stated assumptions across the whole suite. Implicit assumptions are a test design failure. Coverage metrics keep them invisible until a defect propagates through one.
- We build the full assumption list before writing any new tests. New tests written against unstated assumptions replicate the same gap in a newer-looking suite.
5. Compliance Cost Avoidance
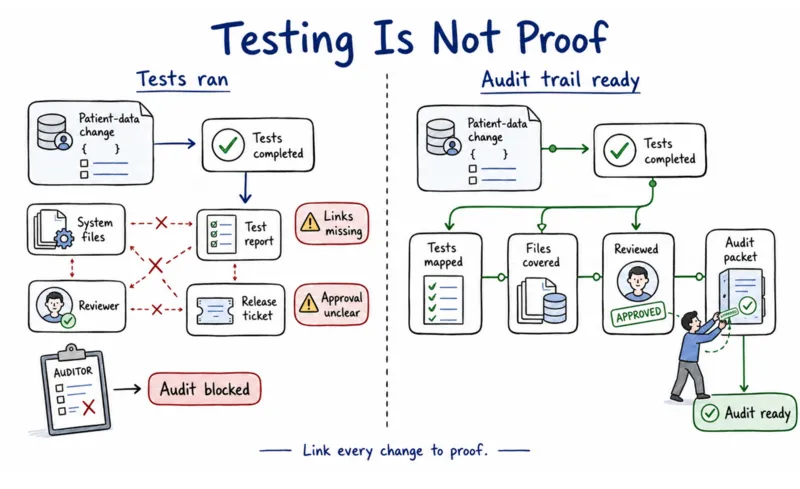
In most healthcare SaaS audits, the tests are run. The traceability did not survive the sprint. Teams can show us that testing happened. They cannot show us which tests covered which patient-data system changes in a form that would satisfy an auditor. That gap was manageable when documentation was an optional context. It is becoming a compliance problem.
The HIPAA Security Rule NPRM (a proposed rule that, when finalized, would require annual technical testing of all systems handling electronic protected health information), published in the Federal Register on January 6, 2025, is converting QA documentation from an optional context to a proposed regulatory requirement. The cost floor for getting this wrong is documented. Healthcare breaches average $10.93M per incident, 2.3 times the cross-industry average of $4.88M. Healthcare.gov is the documented case. The team tested whether features worked. Nobody tested what would happen when millions of people hit the system at the same time. At launch, the traffic exceeded what was modeled, and the system failed publicly. Fixing it cost $1.7 billion.
How to run this yourself
- Pull the last two releases your team shipped that touched systems handling patient data.
- Without searching across more than one tool, try to answer these four questions. Which tests ran against those specific changes? Which system files did those tests cover? Who reviewed and approved the results? Whether all of it lives in one place, you could hand it to an auditor today.
- If answering those four questions takes more than one hour, the traceability gap is there.
- Healthcare SaaS companies that launch payer-integration features and skip this check repeat the same pattern. Functional correctness covered, concurrency and chaos testing deferred, the exposure surfaced when volumes exceeded what was modeled.
How ThinkSys approaches this:
- We assess your documentation against the actual NPRM text as proposed, not a summary of best practice. Most teams assess against a lower bar than the proposed rule sets.
- The gap we almost always find is that the tests ran but the traceability did not survive the sprint. Documentation architecture is different from documentation. We scope the architecture before any coverage recommendation is made.
- A compliant audit trail from existing test runs often requires less rework than teams expect. The tests are there. The linkage between tests and system changes is what needs to be captured going forward.
When to Build This Internally vs. Bring in a Partner
You can run the first-pass version of every category above yourself, and you should, before any vendor conversation. But three of the five are structurally hard to sustain internally:
- Regression-suite architecture needs a named owner separate from test execution. Most teams don't have the headcount to separate the two.
- Coverage-assumption analysis requires a methodology mapping against API contracts and integration specs that most teams haven't built.
- AI-code instability tracking requires PR-metadata auditing that crosses team-ownership lines, which is an organizational problem, not just a technical one.
Start With the Category Where Your Gap Is Largest
Most QA budget conversations end in a gut call because neither side has a number that settles the question. The QA team has a coverage percentage; the business side has a production-incident memory; neither converts to the other.
These five categories convert. Measure them, and you walk into the CFO conversation with a connected model instead of a gut call.
We run this audit for mid-size SaaS engineering teams. We start with the category where your measurement gap is largest, build the quarterly baseline, and back full engagements with a zero critical bug guarantee. The initial audit is free, and the baseline report is yours to keep.
Schedule Your Free QA ROI Audit